
It’s Saturday night – and your system is down, customers can’t access the application any more. And your key developers are not in reach. Sounds like a quite uncomfortable situation. Read here what you can do to prepare for such events – and recover as quickly as possible from outages and downtime events.
The usual steps to remedy problems are clear: understand the issue, fix the root cause. Sounds very straightforward. However, what if the person on call is not the experienced developer and doesn’t know right away what to do? In DevOps teams with shared responsibility and distributed 24/7 support that may happen sooner or later. To be on the safe side you need an approach that enables the people on call to remedy the most common problems without deep expert knowledge. How to prepare for that? Here are some best practices.
(1) Know the usual suspects
Chances are that this is not the first time that the service failed. That may be due to some known but not yet fixed problem, or due to some dependency to an service outside of the team’s control. Such potential “known” issues should be documented prominently, along with step-by-step instructions on how to get up and running again. Ideally this should be part of the ‘troubleshooting’ section of your runbook (see below).
(2) Provide quick diagnostics via monitoring boards
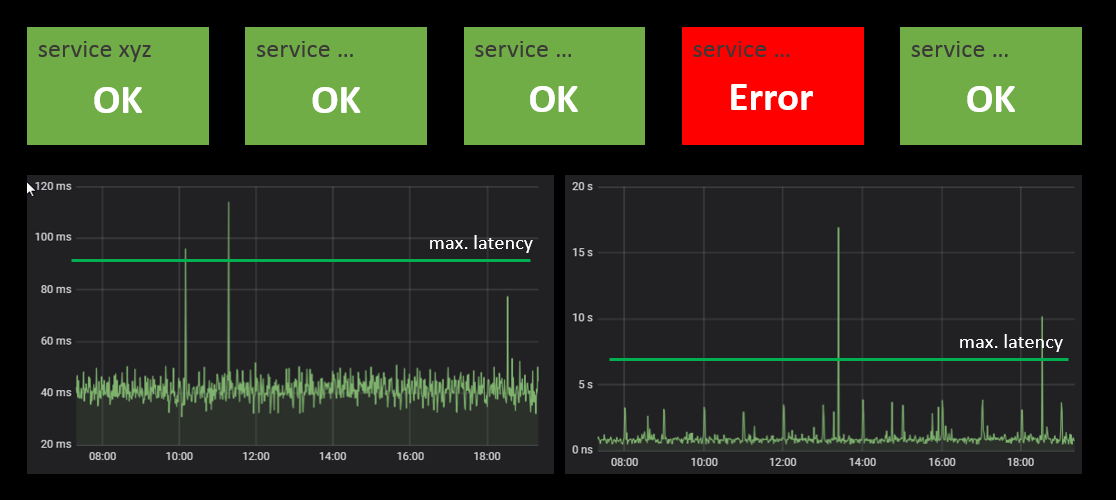
A good monitoring board is the starting point for efficient troubleshooting. Each service should have its ‘health’ board where the status of each major component is displayed, e.g. via green/red status panels. Make sure the overall situation can be perceived at a glance. Where finer grained information is available make it accessible as drill down from these panels. An example: for service latency you can use time series plots over the last few hours. For such display it may be helpful to display horizontal lines within the chart to indicate the ‘normal’ range of the value.

The board should also show the status for each required external service. This will immediately indicate if the own service or some external dependency – like e.g. a database – is the cause of the problem.
Building good monitoring boards takes time and effort. For each component you need to come up with a reliable status test. However the work will pay back sooner or later. Running production systems without such monitors is like driving a car at night without the lights on.
Grafana is a widely used open source tool for building such boards. There are also lots of other tools, including commercial systems that automatically take care of code instrumentation for health and latency measurement.
(3) Set up symptom based fix procedures
This is the most underrated approach to speed up system recovery. It will take some time and effort to prepare but will most likely provide good learnings for the team and put you in a much better position if problems occur. How does it work?
As engineers we are used to start reasoning about system behaviour from the viewpoint of individual components:
“if the database index is corrupt => service xyz will have high latency“
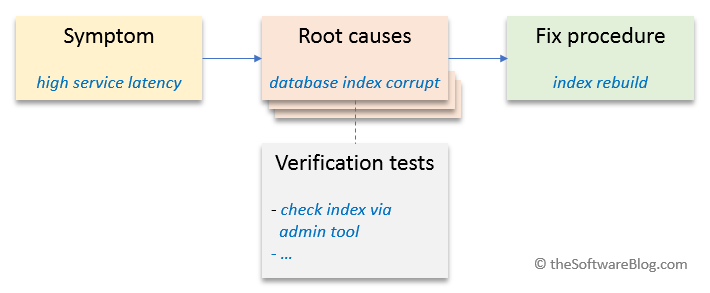
However in an outage situation such information is not very helpful, especially for non-experts. The guys will not see the database index problem – they will see the high service latency. And they want to know what to do about it. So lets analyse the system and set up instructions that start from exactly such observable symptoms. This is how it may look:
“high latency of service xyz may be caused by an overloaded database“
Imagine your 24/7 support had a complete list of possible system problems (symptoms) – and for each of them a corresponding fix procedure. Troubleshooting would be a lot easier. Of course there may be more than one potential root cause. Or additional checks may be required to find out which of the possible causes is the culprit. Here’s the approach to do this analysis in a systematic way. For best outcomes do it with the entire team:
Phase 1: Problem brainstorming
- Brainstorm possible system problems and failure symptoms
- Ask yourself: what can go wrong and how would that become visible in system behaviour?
- Try to make this list as exhaustive as possible
Phase 2: Assign root causes and verification checks
- For each symptom list the possible root causes
- If required or useful: add instructions to verify or exclude the suspected root cause – these are the verification checks
Phase 3: Write down fix procedures
- For each root cause write down the required steps to bring the system back up to normal operation
- If possible include verification instructions – how would you check that the procedure solved the problem?
Congratulation: you just created a troubleshooting guideline : )
Do this exercise with the team, and repeat it every few weeks or months t o make it more complete over time – and to adapt it to modified system behaviour or new features. The troubleshooting guideline is also an essential part of the fourth best practice:
(4) Keep a runbook
Set up and maintain a runbook for each of your applications and services. The runbook contains the basic operational data for the service:
- Name and short description
- SLA (service level agreement or target)
- Involved team members
- Involved artefacts and libraries – and corresponding links to the repositories
- Consumed external services (dependencies)
- Build and deployment approach
- Smoke tests (how would you quickly verify that the service is up and running?)
- Monitoring KPI’s and strategies
- Troubleshooting guideline (see above)
- …and everything else that may be helpful
Keep the runbook up to date – and make sure it is easily accessible for whoever may need the related information.
And how about logging?
Logs are important, no doubt about that. However you should not rely only on logs to find out about your system’s health status. Set up monitoring boards for that purpose. And have your logs ready and easily accessible for verification checks – or situations where the approaches 1…3 did not help and you need to dive one level deeper.